
.avif)
In the last blog, I shared an article on the data literacy of adults. Despite the importance of incorporating data in everyday decisions, especially given the recent pandemic, adults lack skills needed to utilize data effectively. One area where adults were challenged was with interpreting graphs.
In this blog, I will extend the previous finding by discussing graphical comprehension, which is also called graphical literacy. Graphs are at the intersection of mathematics and science and are a key component of data literacy and of statistical literacy. Here I feature two articles that break down graphical literacy into component parts and examine ways that this concept can be taught in the mathematics classroom.
What is graphical literacy?
Various terms found in education research are used to describe similar concepts. “Data literacy” falls under the broader term “informational literacy” and refers specifically to data in all its various forms. “Data visualization” is a recently popular term but has the added component of trying to tell a story with often complex or copious data. “Graphical literacy” is the ability to understand and utilize graphs and can be used interchangeably with “graphical comprehension.” For the purposes of this blog, I prefer to use “graphical literacy” as I’ll be referring to understanding graphs and mechanics of reading and creating graphs.
Traditionally, graphical literacy is represented on three comprehension levels: reading the data, reading between the data, and reading beyond the data (according to Curcio, 1987). Other articles break down graphical literacy into a series of three behaviors: translation, interpretation, and extrapolation/interpolation (Friel et al, 2001) or into five dimensions: reading, interpreting, drawing, comparing, and evaluating the graphs (Uyanik et al, 2023). Most education research utilizes the traditional comprehension levels of Curcio but there are advantages to the other descriptions as well.
Graphical literacy of college students
An article published by Bolch and Jacobbe in 2019 utilized assessment data collected through the Levels of Conceptual Understanding in Statistics (LOCUS) project. The assessment had 23 multiple choice items that aligned with Curcio’s three graphical comprehension levels. Incorrect or blank items received 0 and correct responses received 1 point making 0-23 the possible range of scores. The maximum graphical comprehension score for all 519 college students who took the assessment was 10. This alone indicates that students lack graphical literacy! Looking at each of the levels, students struggled most with reading beyond the data, but also with reading the data. Students performed a little better with reading between the data, but that could be due to having 12 items at this level rather than 6 or 5 items for read the data and read beyond the data, respectively.
The take away message from this article is that we cannot assume our college students know how to read graphs. Despite having graphs taught multiple times at the K-12 level, students are still struggling with these skills. The LOCUS assessment itself used beginning/intermediate items and has three flaws that make it not ideal to assess students’ graphical comprehension. First, the three levels are not represented equally. Second, the items are multiple choice which do not allow for in-depth analysis. Third, the items were scored as ‘incorrect’ regardless of if there was a wrong response or if the item was left blank, so scores could have been higher had students attempted all items. Typical to educational research articles, there is limited information shared on the details of the LOCUS assessment. Fortunately, you can access the full assessment with a free account and there is an option to make your own tests. So, it is possible to use this assessment with your own students to look at their graphical literacy, even with its flaws.
Graphical literacy of math teachers
A more recent article by Uyanik et al assessed the graphical literacy of 33 middle school math teachers working in Turkey. The article itself is not well-written. There are some unclear English grammatical conventions throughout the article and within the assessment items and the item scoring was not clear, making me question some of the results and conclusions. However, the article contains detailed information on the assessment used with a majority of the open-ended items being provided in the article tables and figures. Example answers from teachers and the scoring key for select items are also provided. This information allows the reader to recreate the assessment with minimal effort, if desired.
The power of this article is not only in the inclusion of assessment details but also how graphical literacy is broken into component parts. Most research articles use the three comprehension levels from Curcio, 1987. This article aligns each assessment item with these levels and with five dimensions of graphical literacy: reading, interpreting, drawing, comparing, and evaluating.
With regard to the five dimensions, teachers did well with reading and interpreting graphs. They did poorly on drawing graphs, but that could be due to the four items where teachers were to draw almost identical graphs on the same construct. Teachers adequately compared graphs, but were challenged with viewing the graph holistically, instead focusing on a particular aspect. Only one circle graph with multiple inaccuracies was used to evaluate a graph and teachers did poorly.
Aligning these dimensions to Curcio’s comprehension levels, teachers were able to read the data and did an acceptable job reading between the data, but they did not do well reading beyond the data. Considering the two articles together, it is clear that adults lack graphical literacy skills, particularly with reading beyond the data. With the need in our society to use data and graphs to support decision making, it becomes clear that we, as instructors, need to support the development of our students’ graphical literacy skills.
Learning objectives and assessment
There are other articles indicating that students and adults lack graphical literacy skills, in addition to the two presented here. However, it has been a challenge to find research articles on strategies that can effectively teach graphical literacy skills. (If you know of quality research articles with strategies that work, please send them our way!) So until we have research articles on what works, we are challenged to devise our own interventions that may improve graphical literacy among our students.
One reason I like the article on middle school teachers is that the five dimensions can easily be modified to write learning objectives. Some examples include:
- Identify graph parts and labels (reading)
- Describe relationships between variables represented graphically (reading/interpreting)
- Interpret graph data for meaning (interpreting)
- Draw a graph that tells a story (drawing)
- Evaluate the appropriateness of graphs for given datasets (evaluating)
- Compare data among different graphs (comparing)
With clear and specific learning objectives, it is easier to measure students’ achievement of the objectives. We can align some of the open-ended items from Uyanik, et al, or the multiple choice items from the LOCUS project to these objectives.
For example, the multiple choice example item found in figure 1a of the Bolch and Jacobbe article can be used to evaluate the appropriateness of graphs for given datasets. You can use Figure 1b of the same article or open ended item Q6b found at the end of table 2 of the Uyanik article to assess the objective ‘interpret graph data for meaning.’
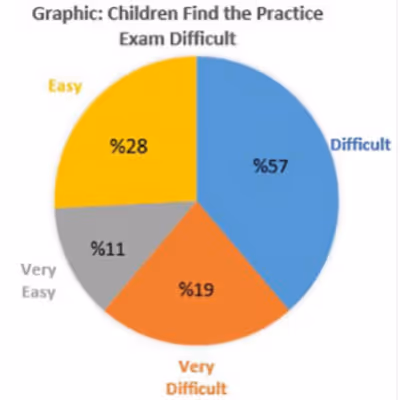
To combine assessment and instruction, you can ask students what they notice and wonder about item Q9 found in figure 6 of the Uyanik article. There are multiple errors in the pie chart (see Figure 1) and making students take a close look at it may encourage them to be more critical of how data is presented!
If you are a member of ModernMath, there are additional resources for teaching graphical literacy. Diane Johnson, Master Teacher for MSUTeach at Morehead State University, created a series of training videos on teaching data analysis. The third session, Interpreting Data, gives some excellent examples of how to teach graphing in the classroom. In particular, there are tools students can use like the Graph Choice Chart from the book Big Data, Small Devices. To expose students to various types of data and graphs, the popular Graphs in the World feature is found on MM and on Instagram. These can be used as additional ‘notice and wonder’ examples.
We know that our students lack graphical literacy skills. But the education literature has little guidance in how to teach students these skills. So, we need to do our own research, writing clear learning objectives, measuring their achievement through assessment, and finding what strategies work for our students.
Bottom Line:
- Students and teachers lack graphical literacy skills.
- Education research has little (if any) information on tested strategies that support the learning of graphical literacy skills. So, we must become researchers ourselves.
- Start with clear learning objectives and align them with available, tested, assessment items to measure students’ graphical literacy
- Try your own interventions to support students’ learning of graph skills. Using ‘notice and wonder’ is a good place to start.


